Power quality
Power quality analysis you can put in front of the utility
MeterSight Gold classifies voltage events against the ITIC/CBEMA envelope, groups disturbances into incidents, retrieves COMTRADE waveforms automatically and opens them in an engineering viewer. Silver covers harmonics and THD events. No cloud, no per-event fees.
ITIC / CBEMA
Every event, on the curve
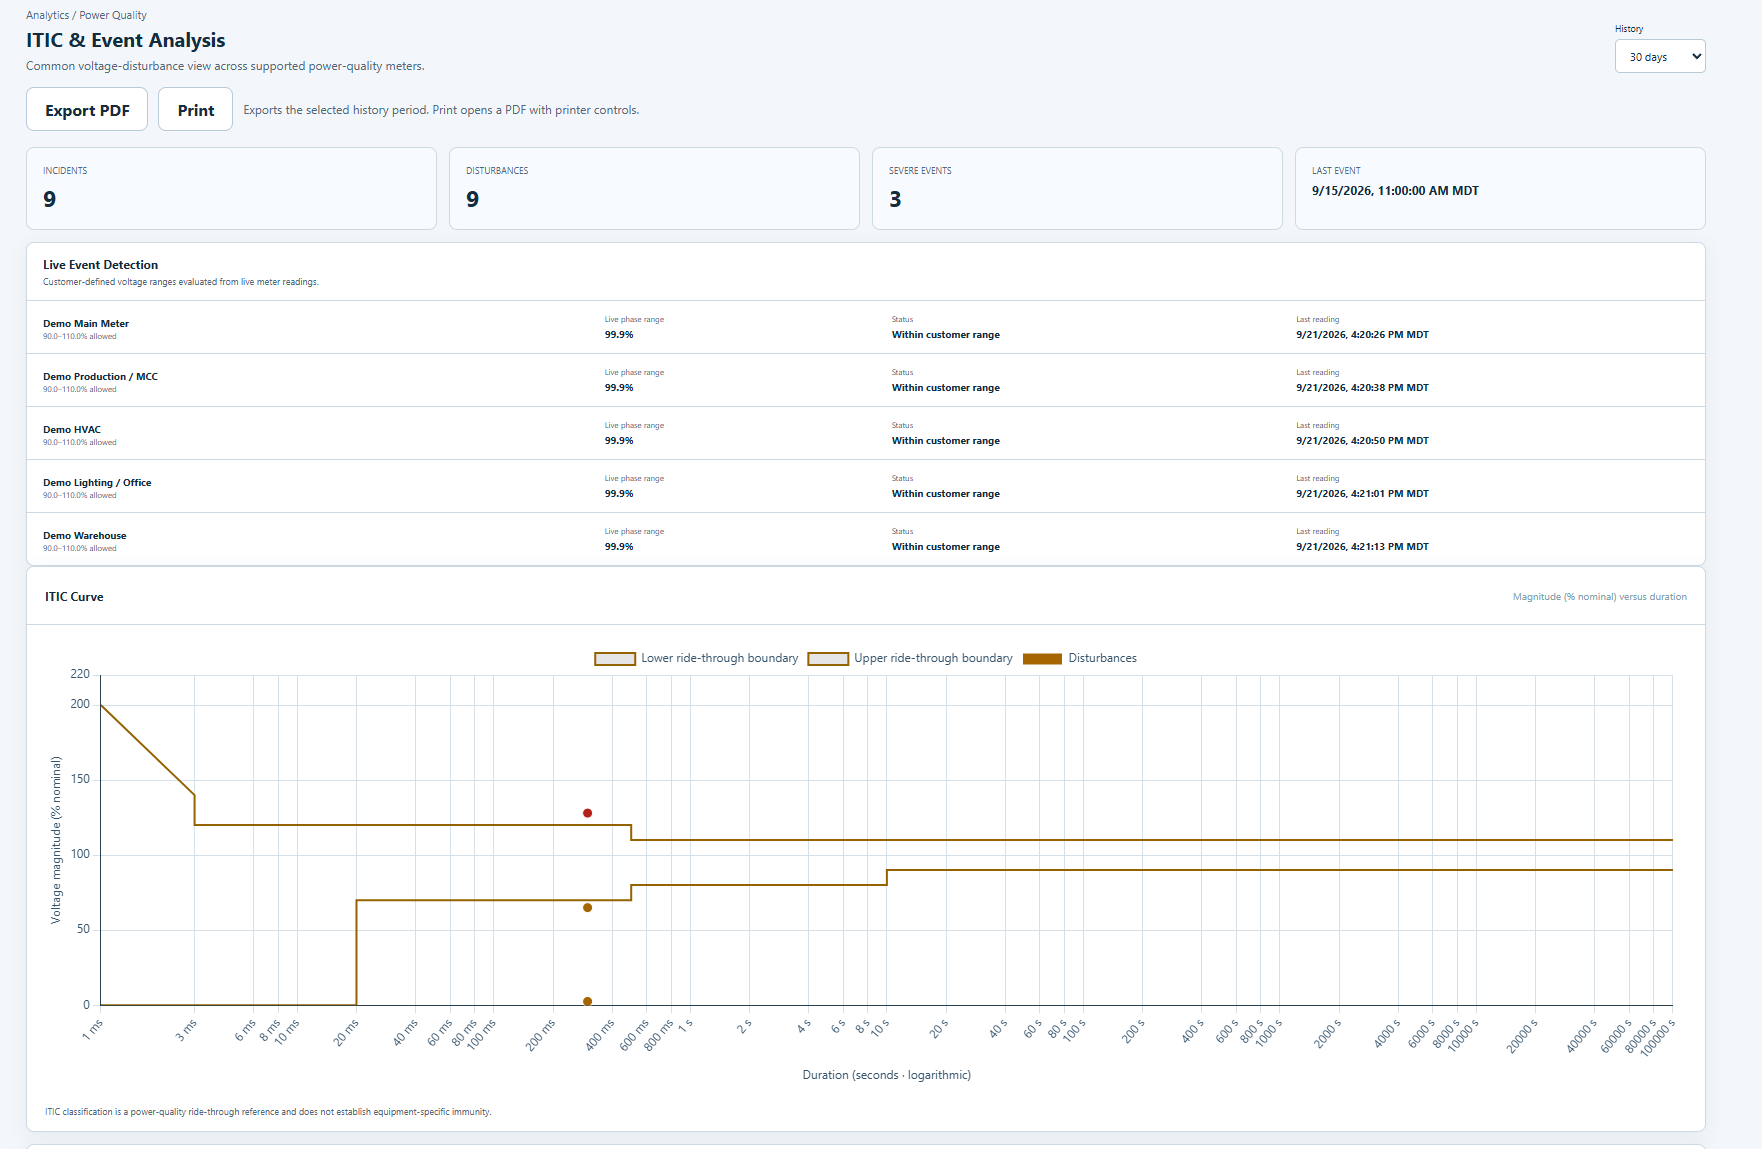
Each sag, swell or interruption is plotted by magnitude and duration on a logarithmic ITIC chart, then classified into a region: inside, outside ride-through, or prohibited. Related disturbances are grouped into incidents so a single fault does not show up as a dozen alarms.
- Printable ITIC & Event Analysis PDF with incident, disturbance and severe-event counts
- Events below 1 ms and out-of-range points stay in Event History and are flagged on the chart
- Light and dark chart palettes tuned for contrast
- Clear disclaimer on every export: ITIC is a reference, not an equipment immunity certification
COMTRADE waveform analysis
Open the waveform without leaving the browser
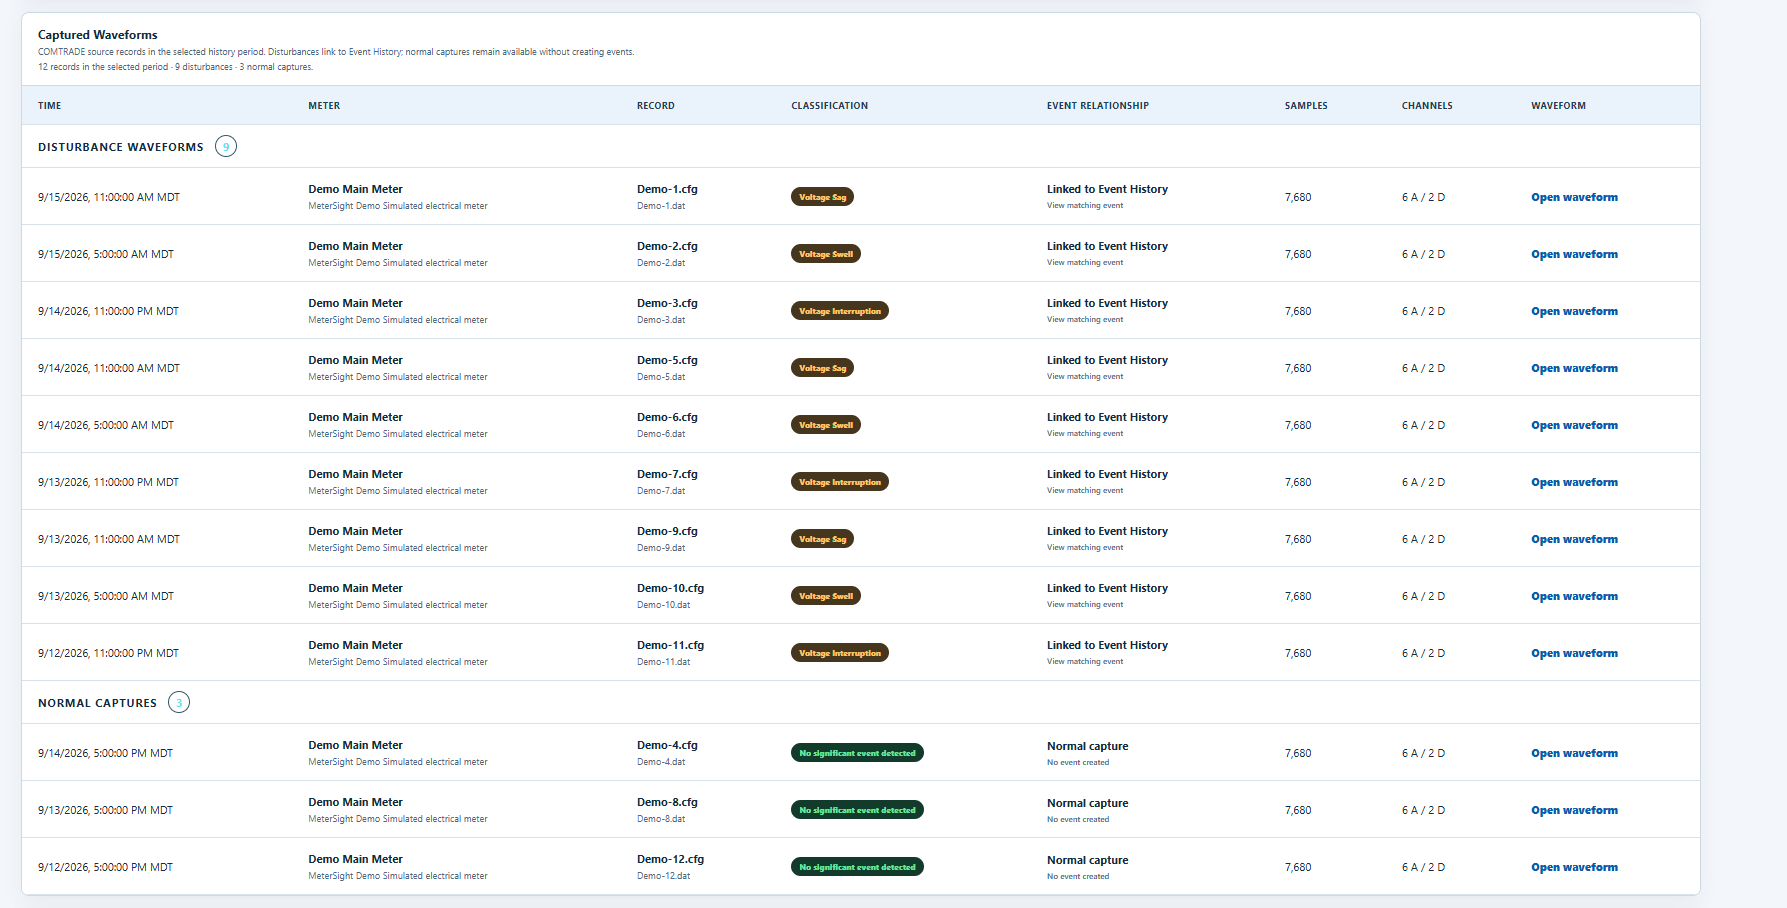
Gold retrieves COMTRADE records from PM8000 and ION9000 meters over read-only SFTP, de-duplicates by content hash, and never modifies the remote files.
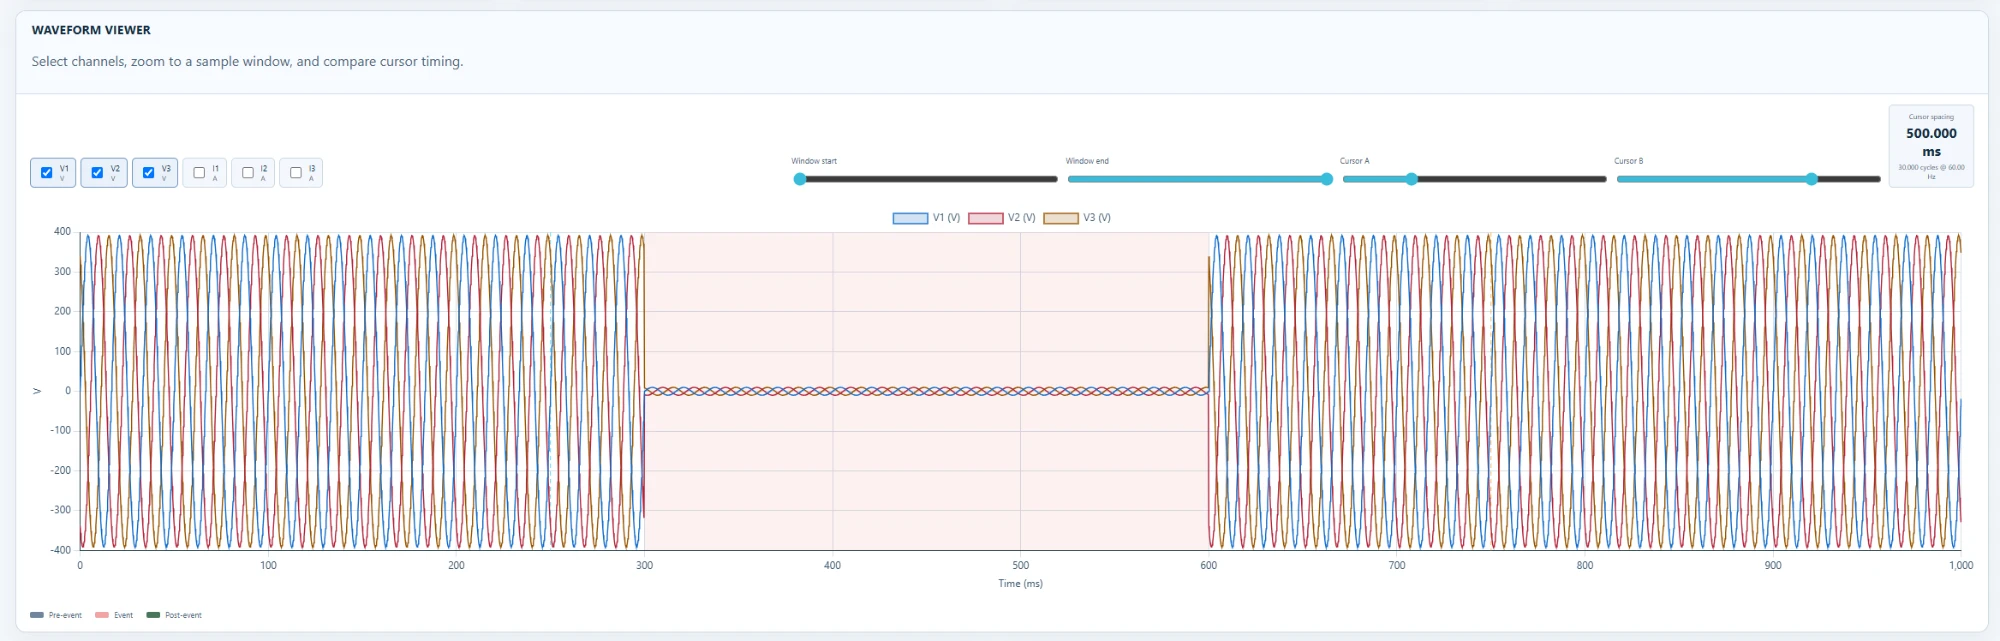
Waveform viewer
Analog channels with zoom and cursor measurements.
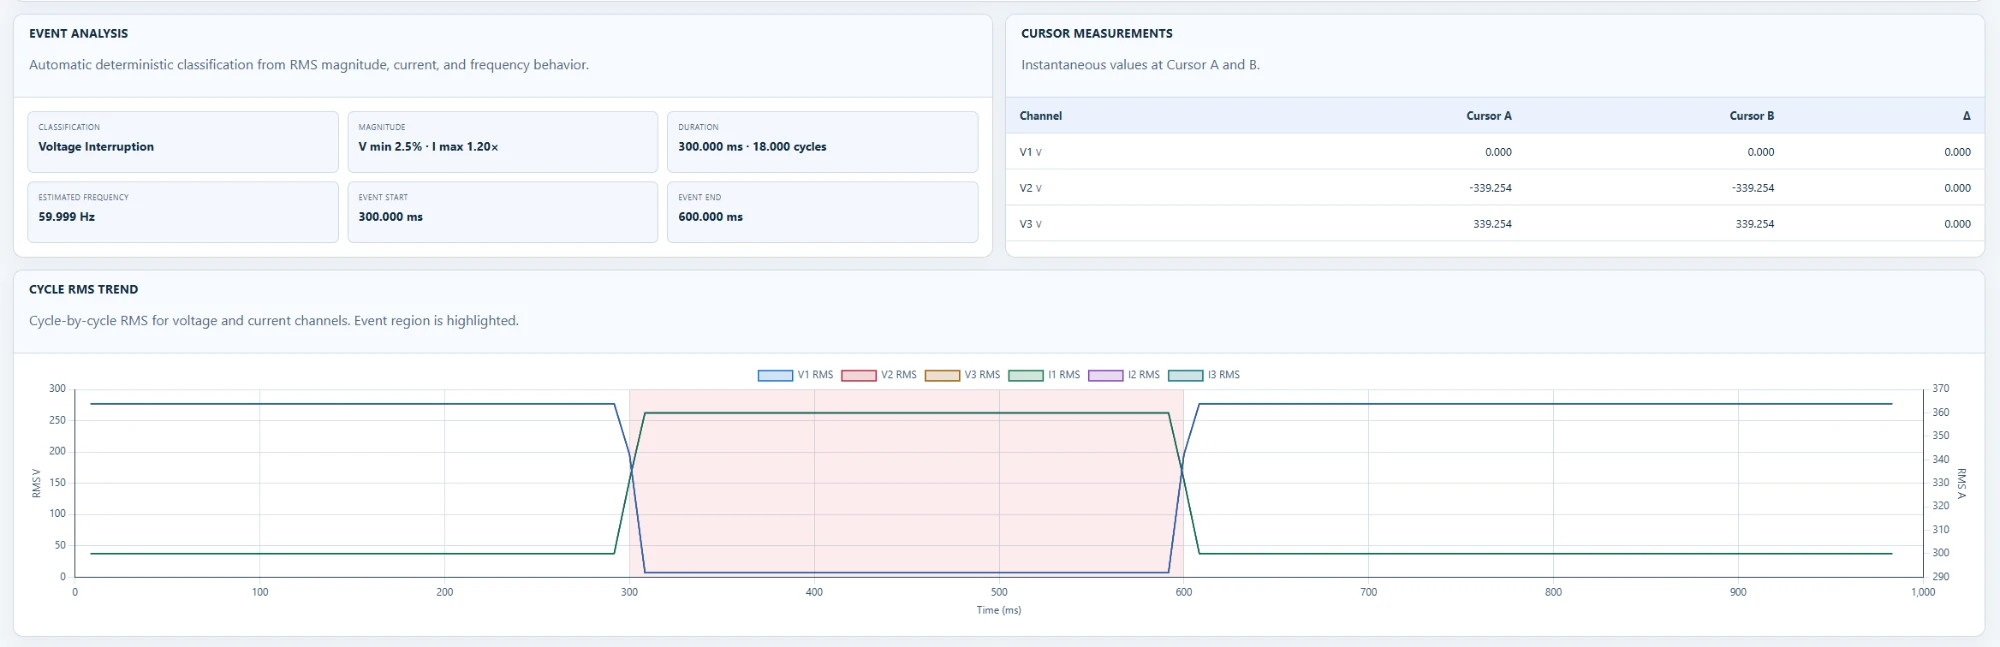
Cycle RMS trend
Per-cycle RMS through the record to see depth and recovery.
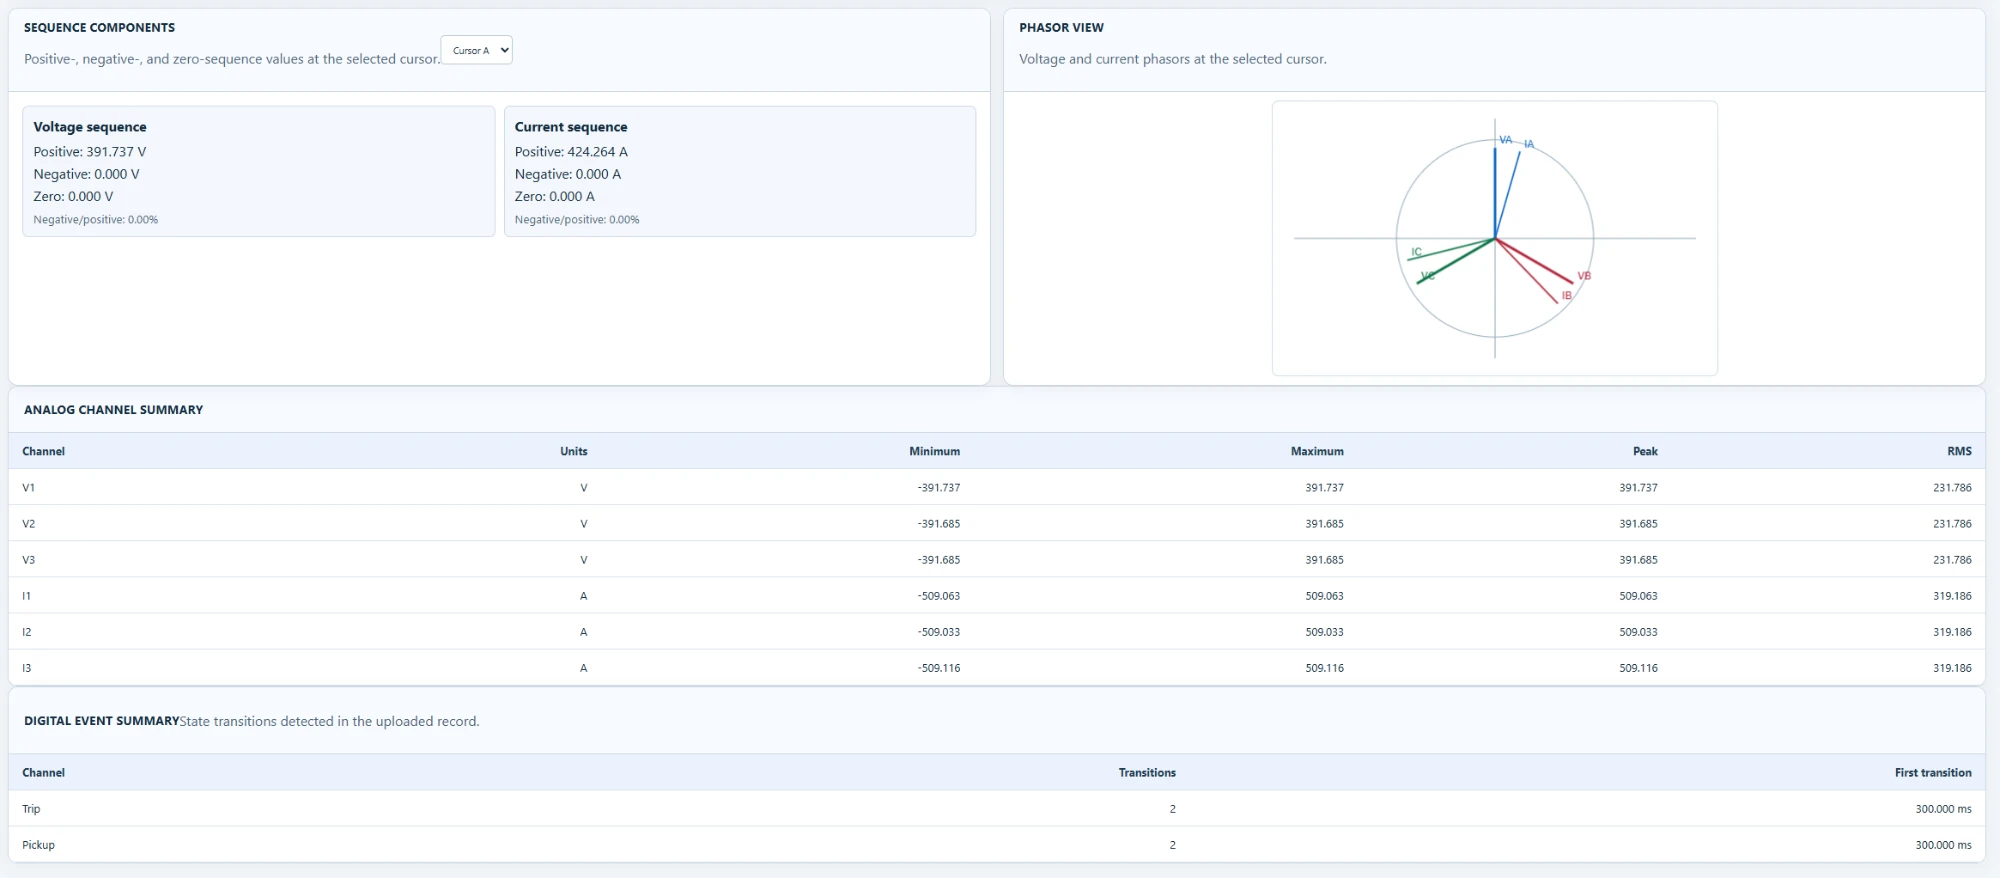
Phasor view
Magnitude and angle for each phase at the cursor.
Sequence components
Positive, negative and zero sequence to characterize unbalance and faults.
Analog channel summary
Min, max and RMS per channel across the record.
Digital event summary
State changes on digital channels aligned to the analog record.
Manual import
Import COMTRADE files from other recorders and relays.
Waveform retention
Configurable retention for waveform storage; defaults to keep everything.
Live event detection settings (Gold)
- Commissioned nominal line-to-line voltage per site
- Low and high acceptable percentage thresholds
- Early-warning band before an event is confirmed
- Event and recovery confirmation times
- Hysteresis to prevent chatter at the threshold
- Voltage sag and swell records with duration and depth
Live detection and harmonics
Detection that does not depend on the meter's event log
Gold watches polled voltages against commissioned thresholds, so even a basic meter produces sag and swell records. Silver and Gold both track voltage and current THD; Gold adds TDD, K-factor and crest factor from meters that report them, and Silver records voltage THD events with a timeline so a pattern from a new drive shows up within days.
By meter
Power-quality collection by meter
| Meter | Onboard events | Waveforms in MeterSight | Notes |
|---|---|---|---|
| Schneider PowerLogic PM8000 | Yes, onboard ITIC | Automatic SFTP COMTRADE retrieval | Firmware register map verified. Scans COMTRADE_1, 2 and 3 folders. |
| Schneider PowerLogic ION9000 | Yes, onboard ITIC | Automatic SFTP COMTRADE retrieval | Firmware register map verified. Adds a transient counter. |
| Socomec DIRIS A-200 | Meter records disturbances | Not available in this release | Monitoring and energy fully supported. |
| Powerside PQube 3 | Meter records events | Automatic collection not available in this release | Register preset present; lab validation recommended. |
| Socomec DIRIS MCM-16 / MCM-48 | No | No | Multi-circuit monitoring and energy only. |
FAQ
Power quality questions
What is the ITIC curve and why does MeterSight use it?
What is COMTRADE?
Can Silver do power quality?
Does MeterSight detect events itself, or rely on the meter?
Bring your last incident
Send us a COMTRADE file or an event log and we will walk through it in MeterSight Gold on a live call.